Preview is where you read the slice before anything is sent to a printer. This lesson, tested in OrcaSlicer 2.4.2 on macOS, shows how to slice, move through the layers, read the colour legend and the estimate tables, and spot problems on screen.
How do you open Preview in OrcaSlicer?
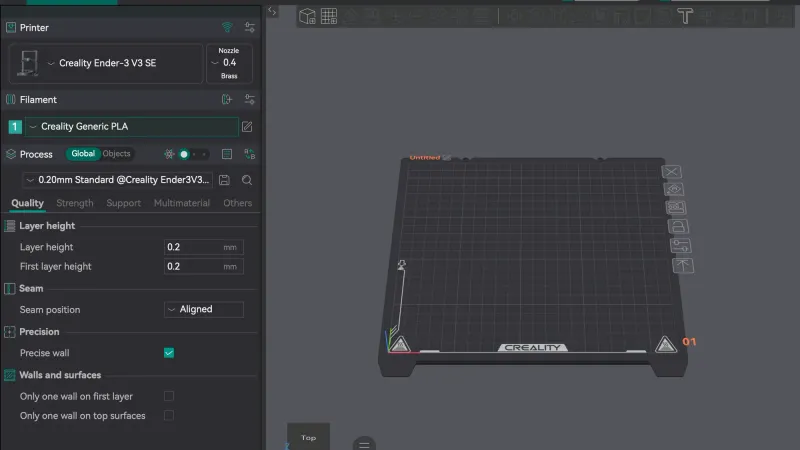
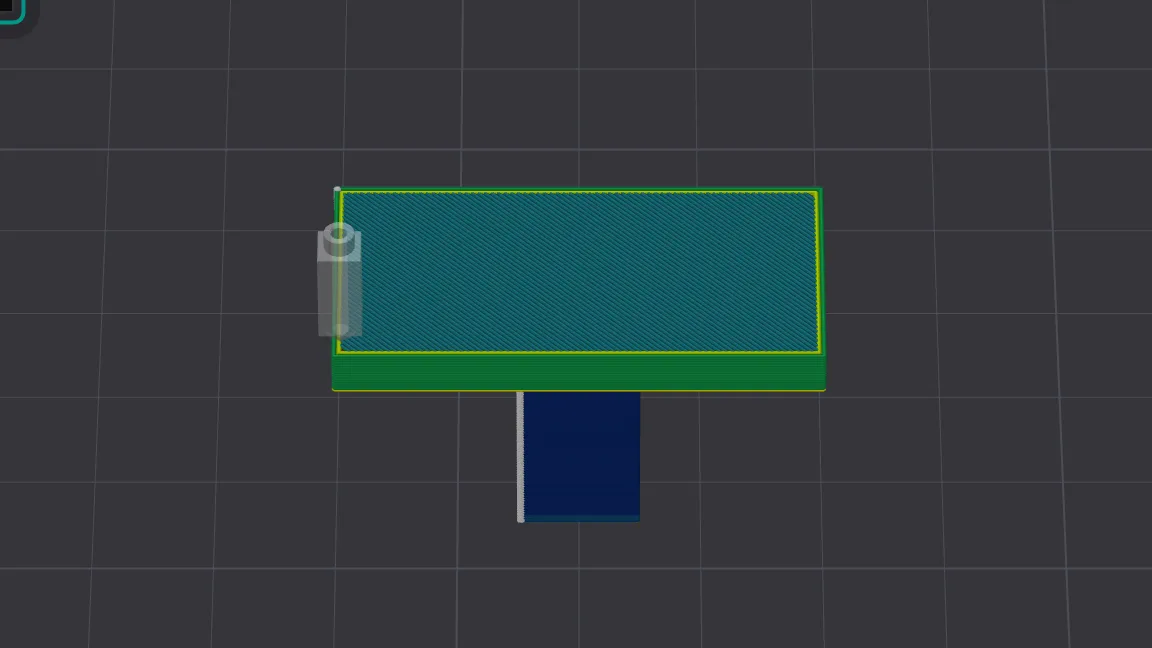
Start on the Prepare tab in Simple mode with the Creality Ender-3 V3 SE, Creality Generic PLA and the 0.20mm Standard Process preset, with the overhang-t test part loaded. Our previous lesson on brim, skirt and seam used the same part. Click Slice plate, top right. If nothing seems to happen, a second click may be needed, as the first can just start the slice. When it finishes, OrcaSlicer switches to the Preview tab by itself and shows a "Slice complete" message. You can also click the Preview tab at any time once a slice exists.
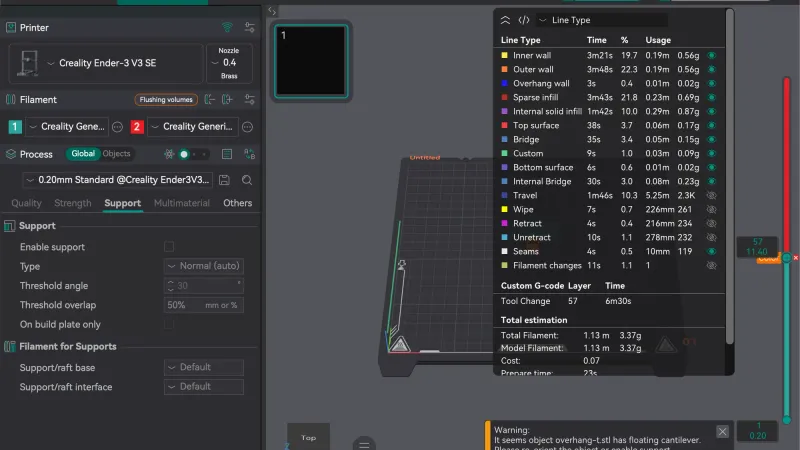
The new slice also shows an orange warning in the bottom right of the 3D view: "It seems object overhang-t.stl has floating cantilever. Please re-orient the object or enable support generation." It ends with a link, Jump to [overhang-t.stl]. That is the slicer flagging the same overhang our supports lesson dealt with, and it is the first example of Preview catching a problem. The tab also has Slice plate and Export G-code file buttons at the top right, but this lesson does not export anything.
One practical point. Our 3D view was still the Bottom view from an earlier lesson, so Preview showed only the underside of the first layer and the layer slider seemed to change nothing. We fixed it from the macOS menu bar with View then Default View, after which the view cube read Top and Front. The View menu also lists Top, Bottom, Front, Rear, Left, Right, Use Perspective View, Use Orthogonal View, Auto Perspective, Show G-code Window, Show 3D Navigator, Show Gridlines, Reset Window Layout, Show Labels, Show Overhang, Show Selected Outline (beta) and Enter Full Screen.
How do the layer slider and horizontal slider work?
Two sliders control what you see:
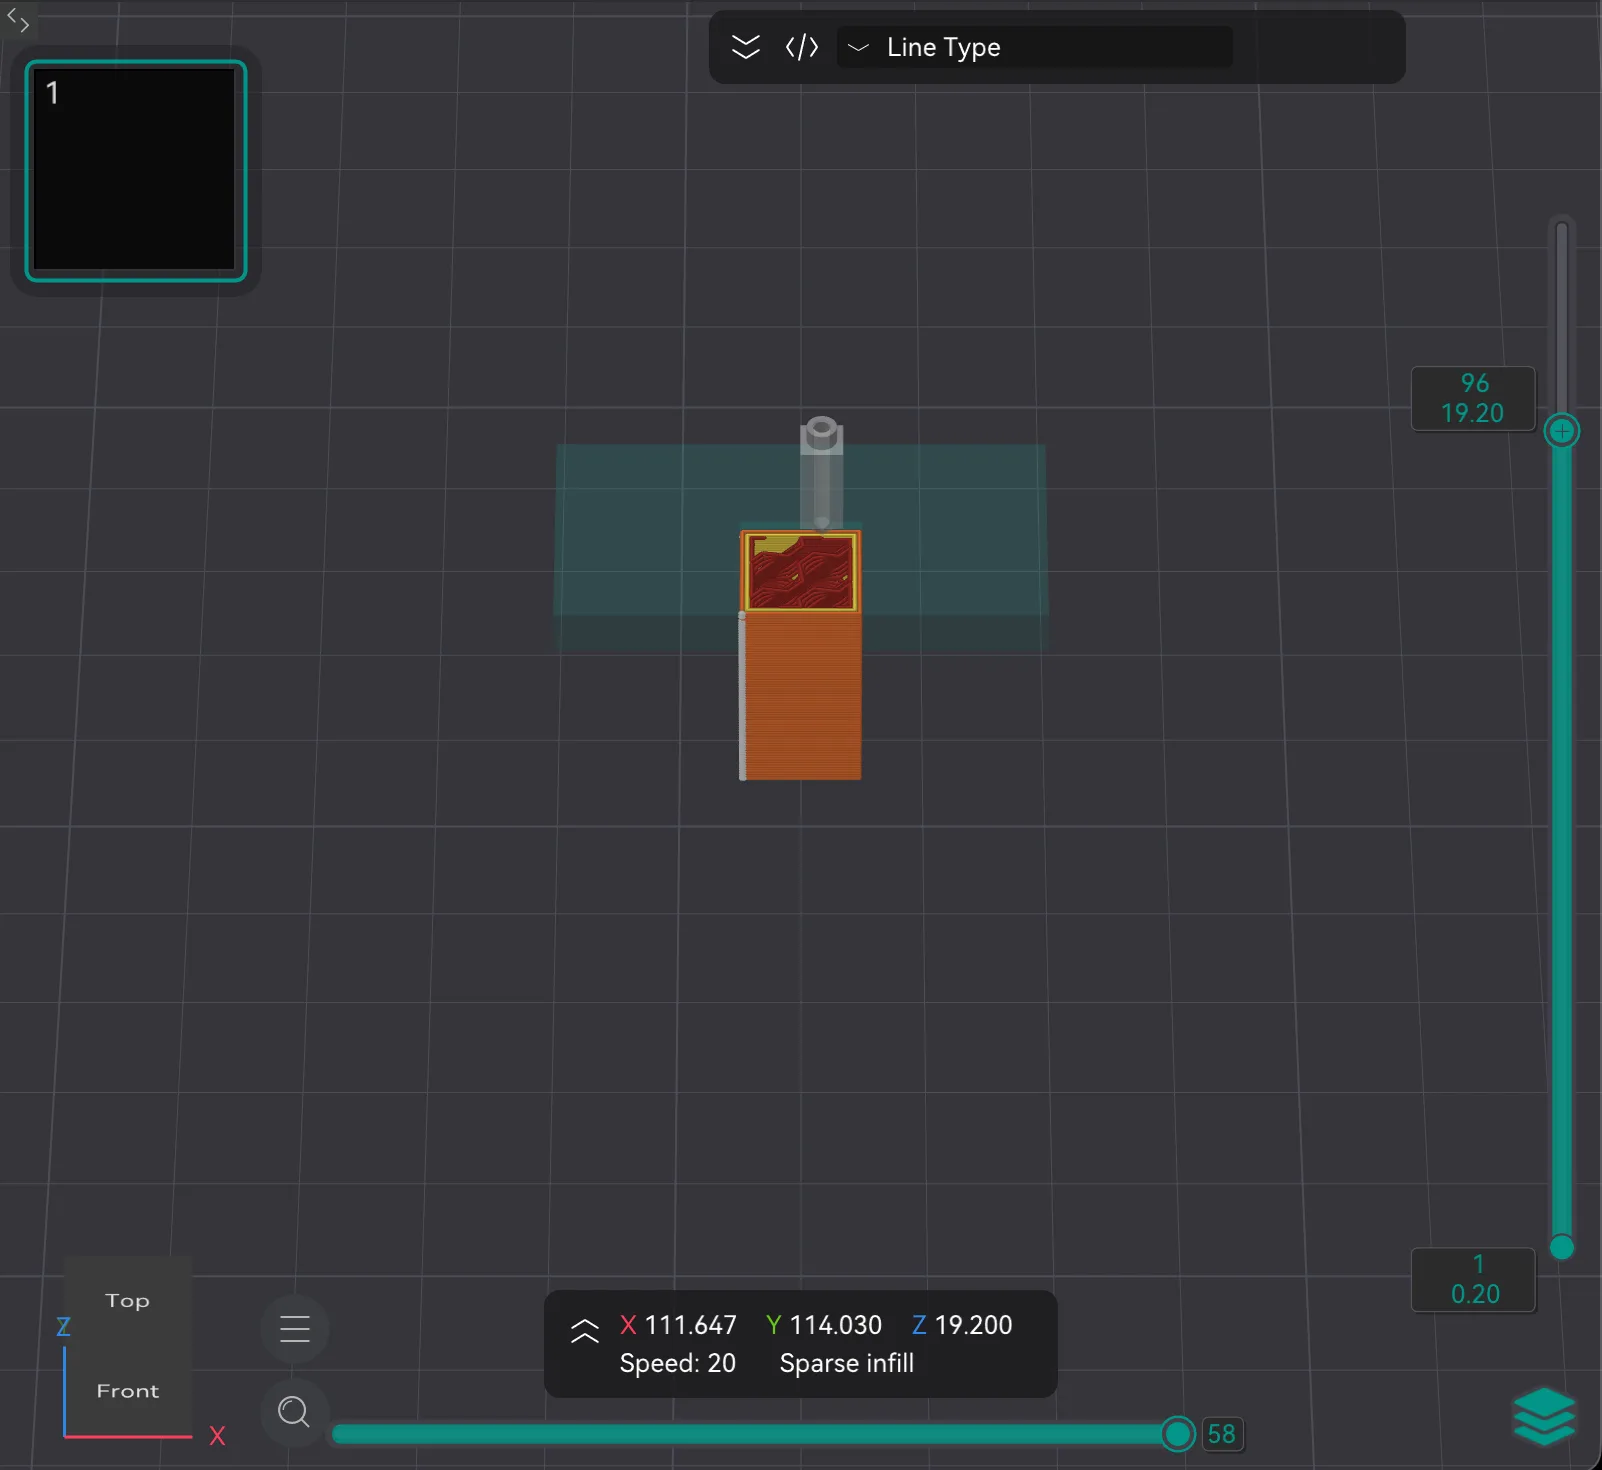
- The vertical layer slider sits at the right edge of the 3D view. Each handle has a label with the layer number above the height in millimetres. Our part showed 1 and 0.20 on the lower handle, and 120 and 24.00 on the upper handle when it was at the top. We dragged the upper handle down and saw 88 at 17.60 mm, then 96 at 19.20 mm. Layers below the upper handle show in colour, and layers above it disappear.
- The horizontal slider runs along the bottom of the 3D view and has a number beside its handle. It moves through the individual moves inside the top visible layer. At its right end the readout was 230 on the final layer, 58 at layer 96 and 149 partway across the top layer.
The small box above the horizontal slider shows X, Y and Z for the nozzle position, plus Speed and either the line type (for example Sparse infill or Top surface) or Height, depending on the view type. A grey nozzle icon in the 3D view marks that position. At layer 96 it read X 111.647, Y 114.030, Z 19.200, Speed 20 and Sparse infill.
What do the colours in the Line Type legend mean?
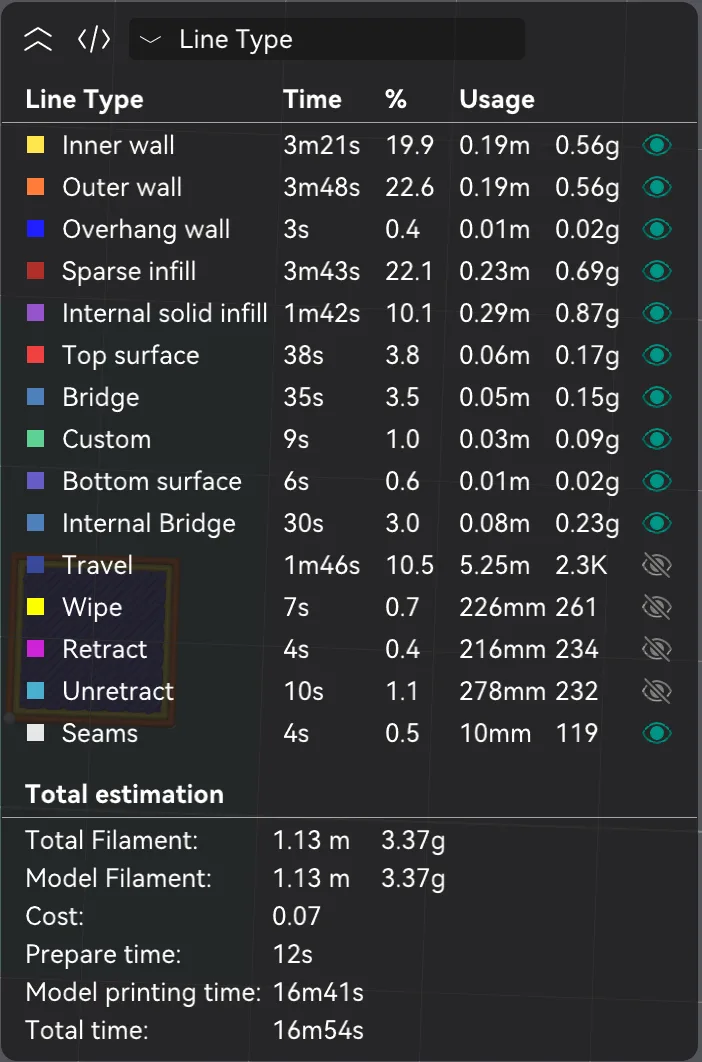
The default view type is Line Type. The legend at the top right of the 3D view lists every line type in the slice with its colour, time, percentage of the total, and usage. The arrow at the left of its title collapses it, which is handy because it covers part of the model. These are the names and colours we read in this build, from our first slice with no support:
- Inner wall: yellow
- Outer wall: orange
- Overhang wall: blue
- Sparse infill: dark red
- Internal solid infill: purple
- Top surface: red
- Bridge: steel blue
- Custom: light green
- Bottom surface: violet
- Internal Bridge: steel blue
- Travel: dark blue
- Wipe: bright yellow
- Retract: magenta
- Unretract: light cyan
- Seams: white
Travel, Wipe, Retract and Unretract have a slashed eye icon, which means they are hidden by default. The others show an open eye. We did not click the eye icons in this lesson. Wall types are explained in walls and perimeters explained, and the infill rows in infill explained.
The Time column for our first slice put Inner wall at 3m21s, Outer wall at 3m48s, Sparse infill at 3m43s and Internal solid infill at 1m42s. The Usage column gives length and weight, except for Travel, Wipe, Retract and Unretract, which show a distance and a count. Under the table, Total estimation reads Total Filament 1.13 m and 3.37 g, Model Filament 1.13 m and 3.37 g, Cost 0.07, Prepare time 12s, Model printing time 16m41s and Total time 16m54s. These are slicer estimates, not print results.
What are the View type options in OrcaSlicer Preview?
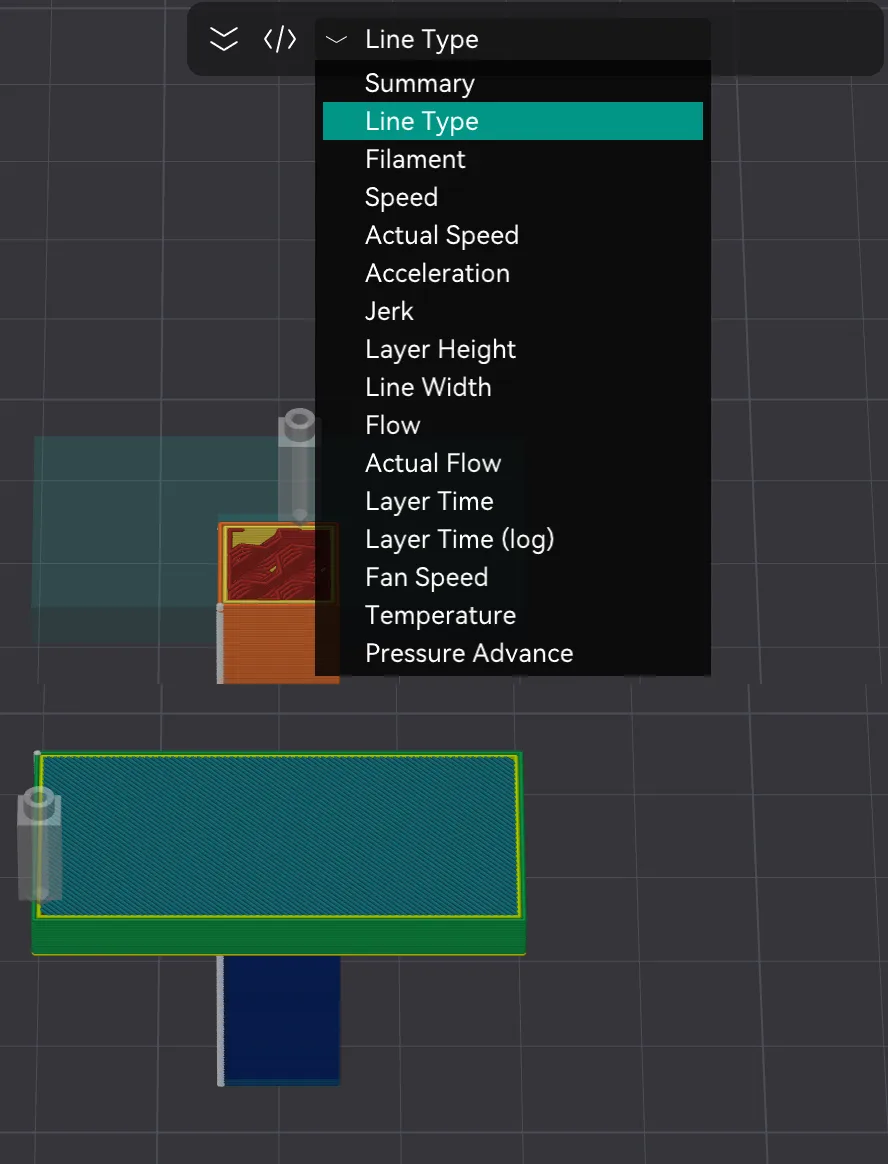
Click the drop-down that reads Line Type at the top of the legend. It has 16 entries, in this order: Summary, Line Type, Filament, Speed, Actual Speed, Acceleration, Jerk, Layer Height, Line Width, Flow, Actual Flow, Layer Time, Layer Time (log), Fan Speed, Temperature and Pressure Advance. We opened two of them. The drop-down sometimes needs the mouse moved over it before the click, and it can close again if you click twice, so click once and wait.
Speed recolours the model by print speed. Its legend is titled Speed (mm/s) and runs in 11 steps: 180, 164, 148, 132, 116, 100, 84, 68, 52, 36 and 20, from red at the top to dark blue at the bottom. It has an Options block with a hidden Travel row and a Time Estimation block. On our part the thin stem came out dark blue, the end of the scale at 20, the top surface teal, and the band under the top green. We did not read a value for every region, and we did not investigate why the stem is so slow. At the top layer the readout box said Speed: 50. For what speed does to a print, see print speed vs quality.
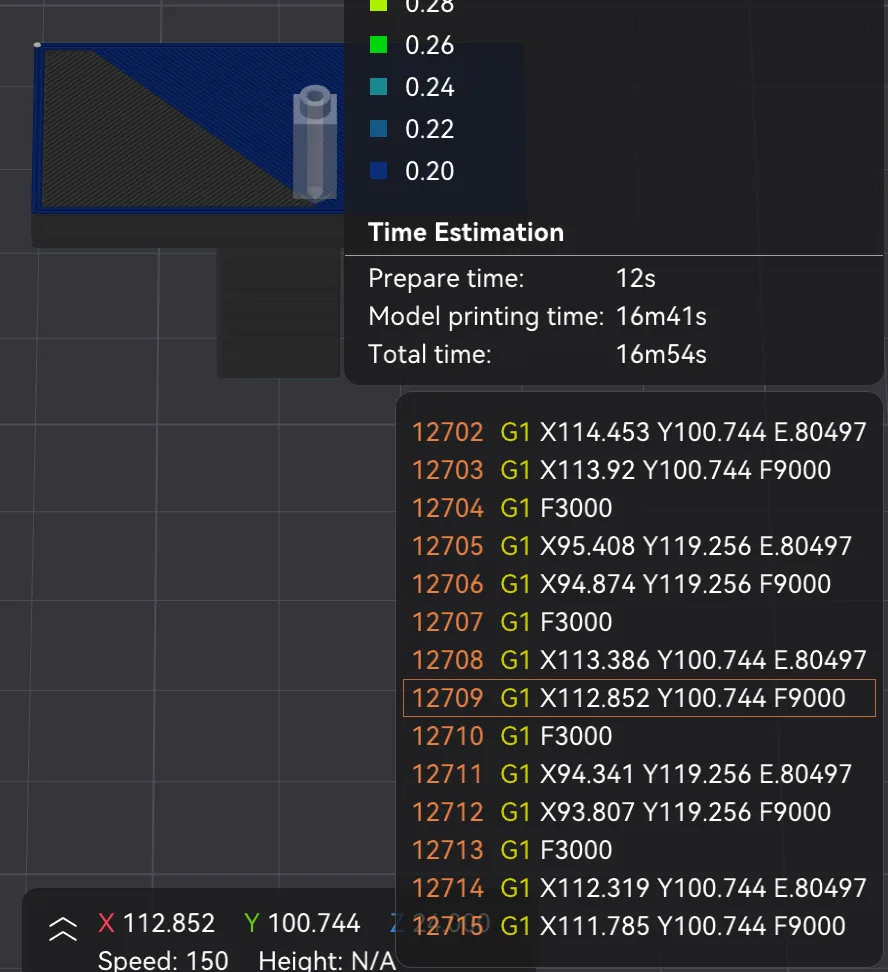
Layer Height has a legend titled Layer height (mm) running from 0.20 up to 0.39 in 11 steps. Our whole part was the darkest blue, which is 0.20, and the readout showed Height: 0.20. That is what a fixed 0.20 mm preset should look like, and it is a quick way to catch a stray variable layer height setting. See layer height explained for the basics.
How do you read the G-code in Preview?
The </> button beside the legend arrow toggles a G-code window. The View menu has the same toggle, named "Show G-code Window - C". The window lists the program lines with their line numbers and highlights the one for the current move. It follows the horizontal slider. With the slider at its far right the highlighted line was 12831, a move to X90.744 Y101.507, and after dragging the handle partway the highlight was 12709, G1 X112.852 Y100.744 F9000. At that position the readout showed Speed: 150 and Height: N/A, because it was sitting on a travel move. We did not edit or export any G-code. Our what is G-code guide explains what the lines mean.
How can Preview show problems before you print?
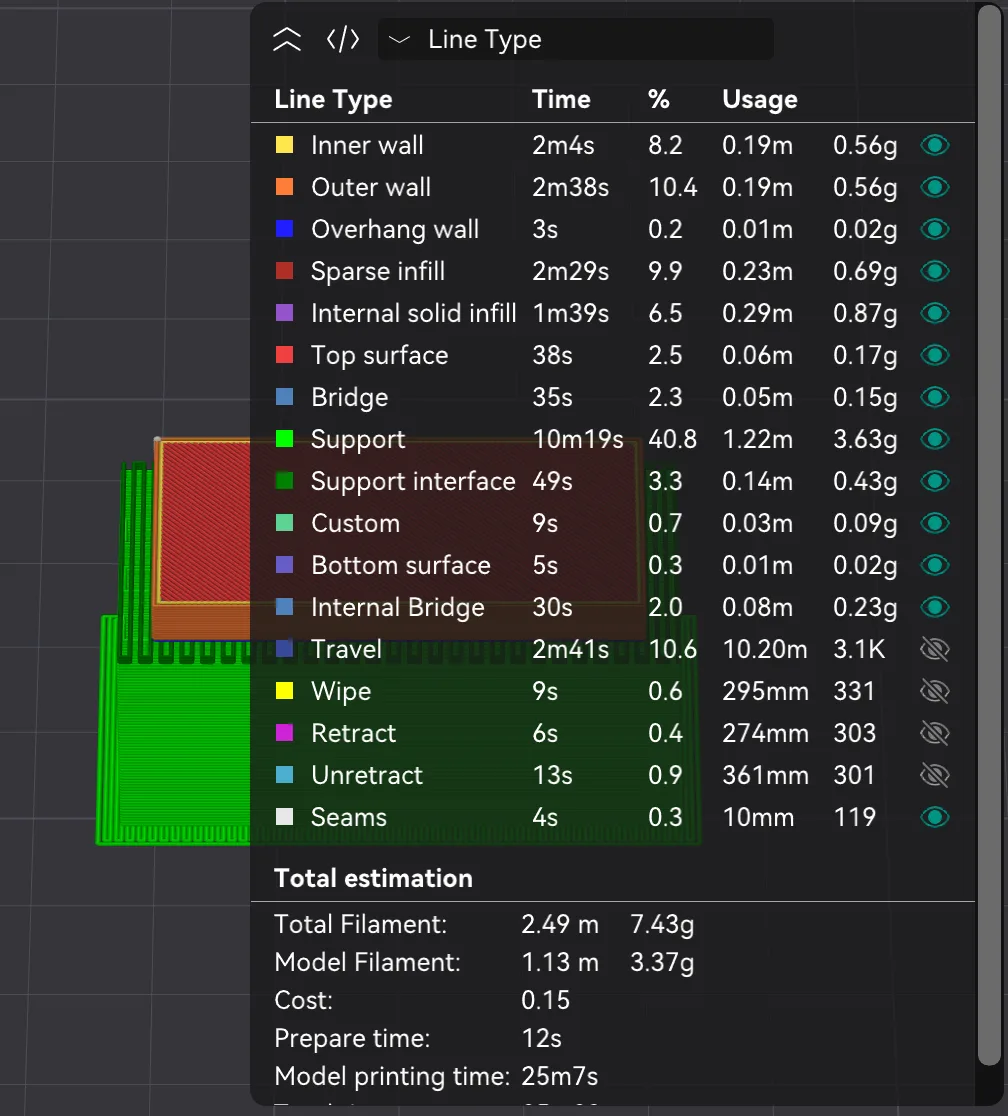
We tried one real check. With the warning still showing, we opened the Support tab, ticked Enable support (the type was Normal (auto), Threshold angle 30) and sliced again. The preset name and the Support tab label turned orange to show a changed value. The Line Type table gained two new rows, Support in bright green and Support interface in dark green, and the green structure appeared under the wide top part of the T.
The estimate changed a lot. Support read 10m19s and 3.63 g, Support interface 49s and 0.43 g, Total Filament went to 2.49 m and 7.43 g while Model Filament stayed at 3.37 g, Cost went to 0.15, and Model printing time went to 25m7s. The layer slider top read 182 at 24.00 mm, compared with 120 before, which we saw but did not investigate. This is what Preview is good at: it makes the cost of a setting visible in grams and minutes without printing. A plain gap with no support under an overhang, or a long list of Support in the legend you did not expect, are both worth a second look. Our supports explained guide covers when support is worth it.
When the check was done we unticked Enable support again, which put the preset back to its saved state. Other things worth scanning for in Preview are a seam dot in an awkward place, sparse infill showing through where you expected solid, and a Layer Time or Speed view that looks wildly uneven. We did not test those views in this lesson beyond Speed and Layer Height.
The next lesson, orca-slicer-calibration-tools, looks at OrcaSlicer's built-in calibration tools.
Next lesson: Orca Slicer Calibration Menu Tests, Explained.